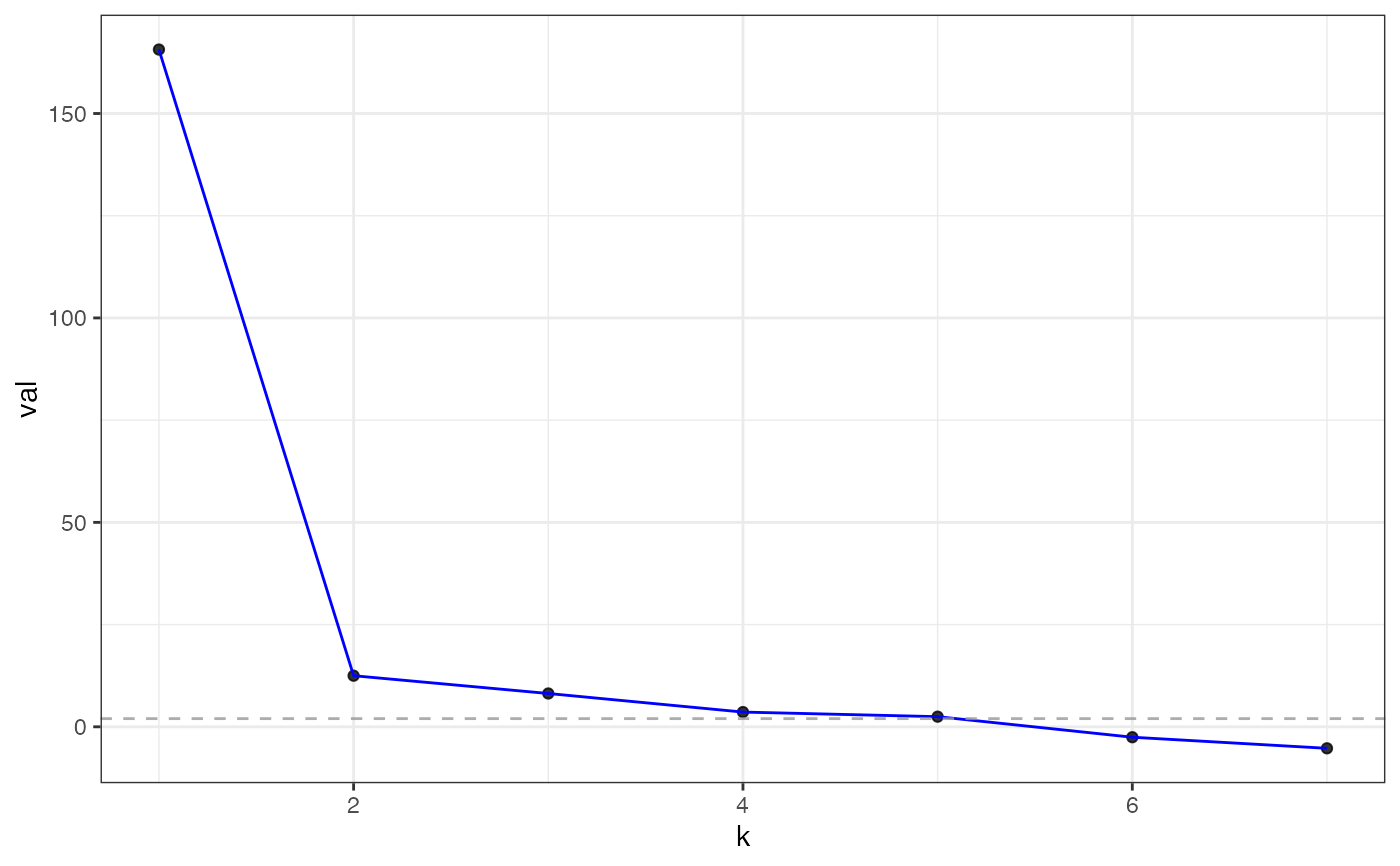
This computes the Z-scores from cross-validated eigenvalues
Examples
library(nycflights13)
im = make_interaction_model(flights,~(month&day)*dest)
cveig = pick_dim(im, dimMax = 7)
plot(cveig)

cveig
#> Estimated graph dimension:	 5
#>
#> Number of bootstraps:		 2
#> Edge splitting probabaility:	 0.1
#> Significance level:		 0.05
#>
#>  ------------ Summary of Tests ------------
#>  k          z        pvals         padj
#>  1 165.640658 0.000000e+00 0.000000e+00
#>  2  12.498316 3.812471e-36 3.812471e-36
#>  3   8.146867 1.867363e-16 1.867363e-16
#>  4   3.603255 1.571284e-04 1.571284e-04
#>  5   2.478655 6.593945e-03 6.593945e-03
#>  6  -2.547305 9.945721e-01 9.945721e-01
#>  7  -5.260579 9.999999e-01 9.999999e-01
#>