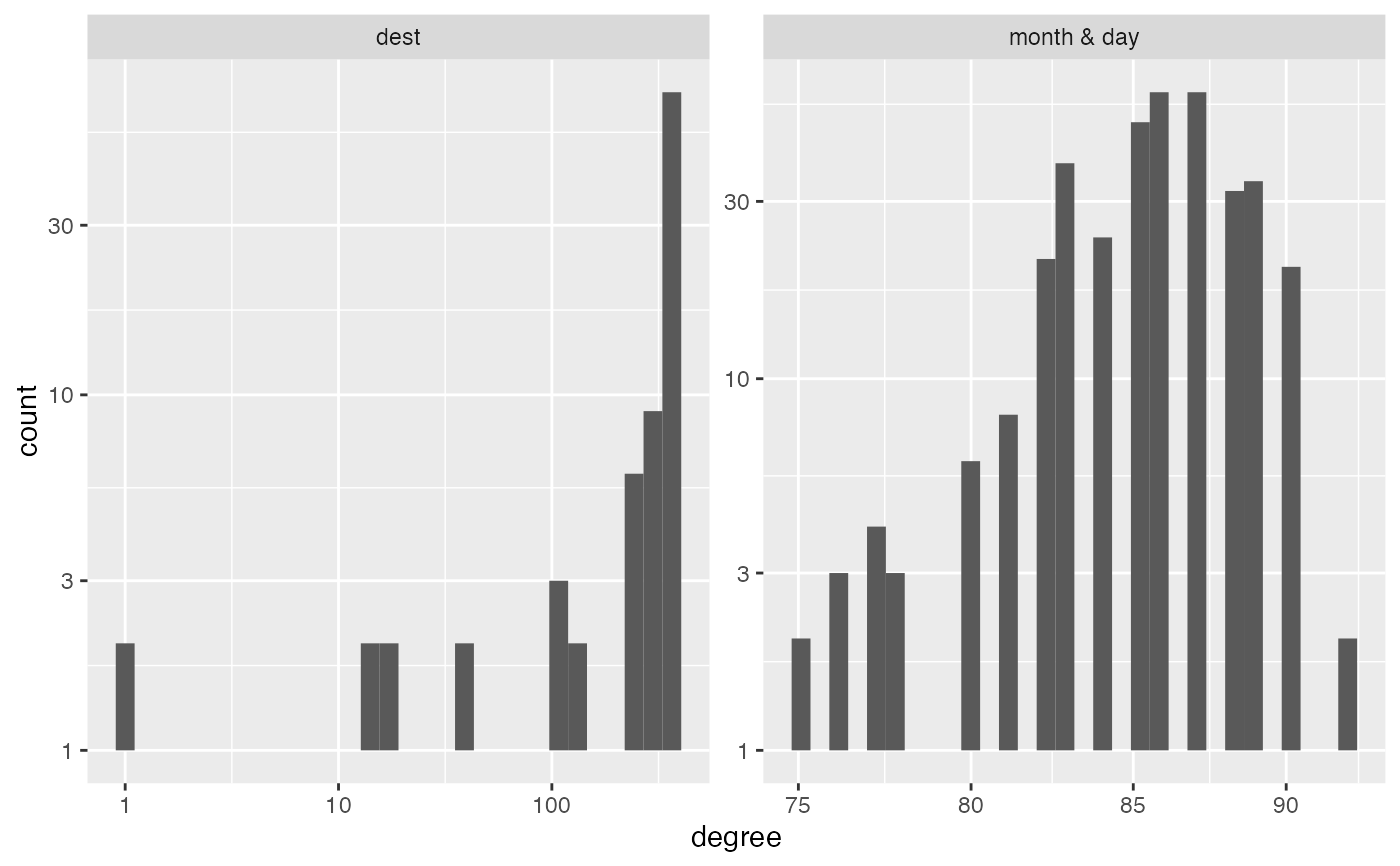
This function helps to see that there is "enough data" for the pca to return reliable results. In particular, it examine the degree distribution with both a printout and a plot. Perhaps run this function before running pca.
Examples
library(nycflights13)
im = make_interaction_model(flights, ~(month&day)*dest)
diagnose(im)
#> Warning: log-10 transformation introduced infinite values.
#> Warning: Removed 28 rows containing missing values or values outside the scale range
#> (`geom_bar()`).

#> # A tibble: 6 × 3
#>   measurement      dest `month & day`
#>   <chr>           <dbl>         <dbl>
#> 1 number_of_items   105           365
#> 2 average_degree    297            86
#> 3 median_degree     365            86
#> 4 percent_le_1        2             0
#> 5 percent_le_2        2             0
#> 6 percent_le_3        2             0
#> # A tibble: 6 × 3
#> measurement dest `month & day`
#> <chr> <dbl> <dbl>
#> 1 number_of_items 105 365
#> 2 average_degree 297 86
#> 3 median_degree 365 86
#> 4 percent_le_1 2 0
#> 5 percent_le_2 2 0
#> 6 percent_le_3 2 0